Since 2007, there have been seismic shifts in the airline industry in the United States. The US has gone from six network carriers to three. Southwest merged with Airtran. Ultra Low Cost Carriers –Allegiant, Frontier and Spirit—have become more prominent. But what has happened to air service? Are specific communities better off or worse off?
Here’s our view. Every community has an interest in having better connectivity to major commercial cities in the US and overseas where much of the world’s GDP is either produced or managed. This includes capitals and major financial and industrial centers. For example, almost a quarter of the US economy is accounted for by the federal government, which is managed in Washington DC. Every community in the US has an important interest in having easy commercial connections to Washington. Similarly, every community has an interest in access to New York, Los Angeles, Chicago and other major commercial centers which produce a large portion of the nation’s wealth and manage many private enterprises. The same logic applies to London, Shanghai or Paris.
So we have developed a metric that measures each US community’s quality of air service to places that matter. We measure the quality of service (considering frequency, number of stops, online vs. interline-alliance service, and aircraft type) to 100 airports (the top 50 domestic and the top 50 international, as measured by number of non-stop seats), weighted by the relative economic output of the destinations.
We found that there is a very tight relationship between each US community’s quality of air service and the size of its economy. It is generally true that a US city with higher GDP also has better quality air service. But some cities do much better than expected while others do much worse. Exhibit 1 shows the results of the GRA Air Service Index (GRASi) for selected cities in 2014.
Exhibit 1: Quality of Air Service to US Cities in 2014
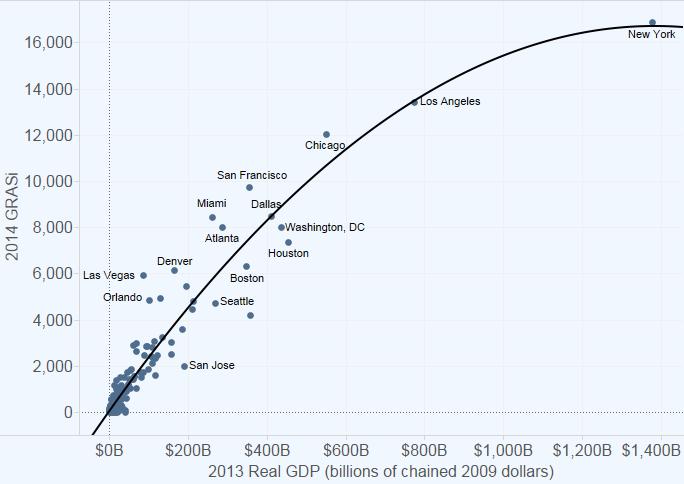
GDP data for each city (CBSA) from the US Bureau of Economic Analysis; multiple airports in some cities.
Of course New York and Los Angeles have the best air service by our metric; they also have the highest GDPs among US cities. But Chicago is substantially above the trend line, and so are other cities with major hubs– Miami, Atlanta and San Francisco. Surprisingly, some cities with major hubs are far below the trend line – Houston and Washington. The reasons for these outcomes are all unique, and have implications for each city’s future and its air service development strategies. We will explore why in a future post.
What has happened to air service since 2007 – before the Great Recession and before airline consolidation? The answer is in Exhibit 2.
Exhibit 2: Change in Air Service Quality Since 2007 by FAA Hub Type
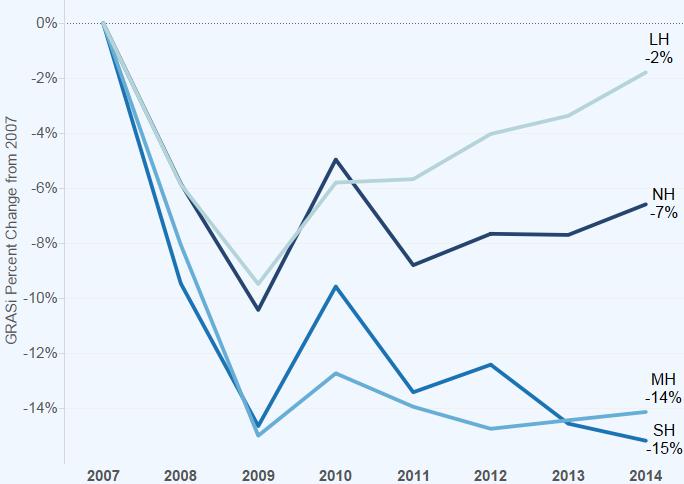
Airports classified by FAA designation in 2013:
Large Hub (LH), Non Hub (NH), Medium Hub (MH), Small Hub (SH)
The quality of air service across all US commercial airports is down an average of seven percent. It reached a nadir in 2009 when it was down an average of 11%, and has had a choppy recovery since then. Large Hubs (FAA designation) as a group have almost fully recovered air service quality to pre-recession levels. But the quality of air service at Small and Medium Hubs, some of which were formerly connecting hubs for major carriers, has not recovered from recession levels.
The quality of air service will affect a city’s future in a connected world economy. Keeping track of service to places that matter economically should be part of a smart economic development strategy for every community.
Read more about the GRA Air Service Index (GRASi) here.
For more information, contact GRA.
May 2015 ©GRA, Incorporated